While big data is now the driving force of corporate decision making across the globe, many companies still fail to understand the full potential of what their data has to offer. Caught in a minefield of over-reporting, under-analysing and ever-evolving compliance issues, organisations can be left paralysed, unable to translate true meaning from their data and effectively turn insight into action.
In 2021, effective data reporting is no mean feat. In fact, businesses are currently spending over $180 billion annually in an attempt to get it right. Despite this, 95% of businesses identify unstructured data as a challenge within their business, with poor data quality costing $3.1 trillion per year in the US market alone. Clearly, more needs to be done for companies to make the most of their data, and consumable analytics might just be the way forward.
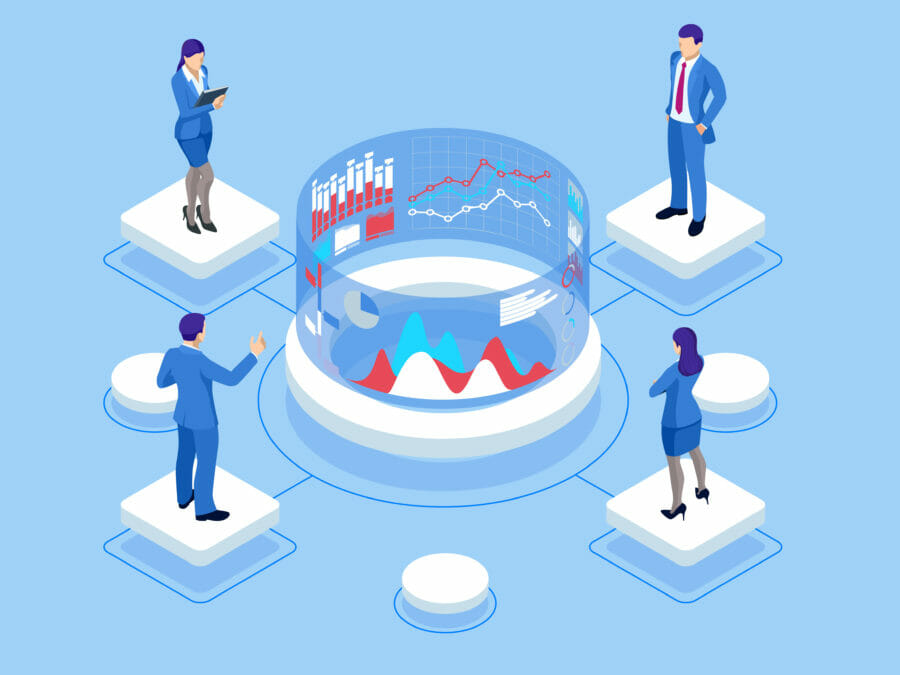
Put simply, consumable analytics visualises data. It brings together vast amounts of information and presents it in a straightforward and easy-to-understand format, so that as the user navigates the business system, they are exposed to the patterns and trends they need without having to manually search for that data. Every record becomes a dashboard that can be easily interpreted by the user, alerting teams to key data insights in real time and allowing them to take appropriate action quickly.
Let’s take a change in total monthly revenue. This could indicate a variety of issues, such as inaccurate forecasting or a poor sales period, much in the same way that a sharp increase in customer help desk requests could indicate a faulty product line or technical problems online. This kind of information would take considerable time and man-power and can easily be caught too late if there is not a specialist team consistently monitoring these reports. Consumable analytics flag these changes as they happen, saving time and resources to identify the problem and focus on a solution.
This is more important than ever within increasingly agile working environments, where remote and hybrid working is becoming widely accepted as a new normal. It’s crucial that businesses are empowering their employees and teams to perform at their best, and for that, it’s about giving them the tools they need to succeed. It’s unlikely that most of your team is made up of data scientists, so while powerful systems exist for those who are equipped to deep-dive into data and undergo complicated analysis and reporting, consumable analytics makes data accessible to the entire organisation, leading to better business outcomes across the board.
And the benefits don’t end there. On top of creating an excellent environment for improved decision making, consumable analytics supports companies to forecast revenues and costs, allocate the correct resources to business initiatives, better understand consumer buying personas and identify changes in the market, measure employee performance and address problems within product lines. Companies have also cited an 8-10% increase in profits due to effective data reporting and a 10% reduction in overall costs.
Evidently, there is huge potential for improved business outcomes by streamlining and visualising data. But before data reaches dashboard, there are a number of key steps companies can take to ensure their data is being collected in the most efficient way.
Eradicating silos to get the best out of data
Avoid collecting data for data’s sake
Knowing the impressive value of data analysis, it can be easy for large companies to go into overdrive and collect as much data as possible, without a clear understanding of how that data fits into wider business goals. Organisations must begin by laying out a clear set of objectives for what they’d like to achieve from their data, before ensuring that each data set gathered supports these greater goals. This not only enables companies to be much more targeted in their decision making, but helps avoid information overload too.
Create a strategy
With these goals in mind, a wider strategy should begin to present itself. For example, if a firm is looking to forecast sales performance over a certain period, it would make sense for them to collect and analyse data on previous opportunity wins, win:loss ratio, conversion rate by sales representative and growth from the previous period. By taking a tactical approach to the information gathered, companies can make proactive decisions about what’s to come, as opposed to reacting to changes once they have already arisen.
Make it consumable
With a selection of streamlined and strategic data sets, businesses can then move on to making data accessible to the whole organisation. By embedding tailored dashboards into the systems that each individual team uses, employees are exposed only to the insights relevant to them at that point in time, presented in visual bitesize chunks. This not only saves time, but enables all divisions to make better decisions, empowering employees in their roles and encouraging more strategic thinking across the entire company.
How to inspire and empower your remote or hybrid workforce
Don’t drop the ball
Even with these key processes in place, it is still all too common for businesses to collect data and store it away somewhere for a rainy day. Data sets and business objectives are consistently evolving, so it is crucial that businesses set up regular review points to ensure the data collected is still contributing to the organisation’s wider goals. This may mean a refreshed approach every few months, but it will be worth it for long-term business success.
As data analytics tools become more and more advanced, businesses will continue to collect unimaginable volumes of data on their customers, employees and business performance. But the organisations that will reap the rewards are those which ensure their data is visual, targeted and actionable across the entire company. It’s taking the wealth of information at their fingertips and making it consumable.


