Today, graphs are used in a wide variety of government contexts. Graph databases have been deployed to address everything from managing global pandemics, improving urban planning and preventing fraud, to simply making sense of large volumes of interrelated data. Because of their ability to flexibly model and make sense of connected data, graphs have seen growing adoption as governments seek to make better decisions.
Graphs to combat Covid-19
One of the most obvious use cases for graphs is for contact tracing for Covid infections, as is being done in Singapore and Vietnam. Because Covid-19 proliferates through social interactions, graphs are perfectly suited to helping scientists and policymakers expose and understand connected data – from tracing connections through complex social networks to understanding dependencies between people, places, and events.
Graph databases efficiently mirror complex networks of entities. In a graph scenario, people, places, and things are treated as ‘nodes’, and the connections between them are called ‘edges’. Tracing connections between people when they spend time together is one obvious aspect of how graphs are useful for responding to the spread of Covid-19, as well as identifying clusters of elevated activity. In China, a group of researchers built a graph-based application that allows citizens to check if they came in contact with a known carrier of the virus, based on travel data collected when a large volume of people returned home from Chinese New Year.
IT hindering UK public sector response to Covid-19, finds study
Graph technology is helping to solve urban problems
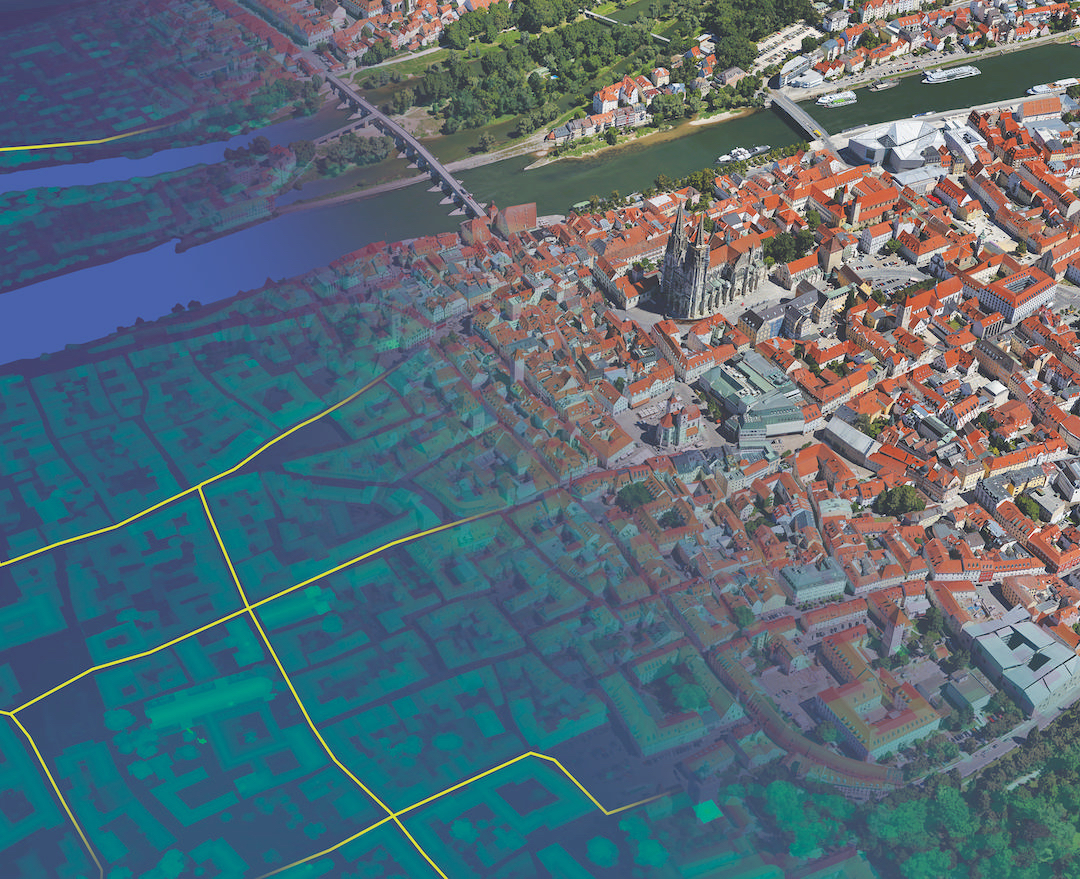
Another government context for use of graphs is global smart city projects. For instance, in Turku, Finland, graph databases are being deployed to leverage IoT data to make better decisions about urban planning. According to Jussi Vira, CEO of Turku City Data, the IT services company that is assisting the city of Turku to achieve its ideas: “A lack of clear ways to bridge the gap between data and business problems was inhibiting our ability to innovate and generate value from data”. By deploying graphs, his team is able to represent many real-world business problems as people, objects, locations and events, and their interrelationships.
Turku City Data found graphs represent data in the same way in which business problems are described, so it was easier to match relevant datasets to concrete business problems. Adopting graph technology has enabled the city of Turku to deliver daily supplies to elderly citizens who cannot leave their homes because of the Covid-19 pandemic. The service determines routes through the city that optimise delivery speed and minimise transportation resources while maintaining unbroken temperature-controlled shipping requirements for foodstuffs and sensitive medication. This graph-based route optimisation aids the planning and management of safe and resource-efficient food distribution.
Graphs for decision support and situational awareness
Curbing fraud is another central graph-based government use case, especially Covid-related fraud. Cyber criminals are exploiting the spread of the pandemic in order to carry out fraud and cyber crime, pinpointing aid programmes as easy targets. In their efforts to hinder such cyber-attacks, researchers at MITRE Corporation, a US federally funded, not-for-profit company, have been using graph technology to develop a special security decision support tool called CyGraph, a cyber warfare analytics, visualisation and knowledge management platform.
Use cases for AI and ML in cyber security
CyGraph brings together isolated data and events into an ongoing overall picture for decision support and situational awareness. It prioritises exposed vulnerabilities mapped to specified, identified potential threats, in the context of protecting mission-critical assets. It also correlates intrusion alerts to known vulnerability paths and suggests the best course of action for responding to attacks.
For Steven Noel, a cyber security researcher at MITRE, “graph queries make it possible to focus our analysis on the relevant portions of attack graphs, allowing us to pinpoint vulnerabilities and target responses”. The use of graph database technology provides insight into the mission impact of cyber activities. Graph layers (network infrastructure, cyber defence posture, mission dependencies, etc.) define subsets of the overall model space with connections within and across each layer. Analysts also gain visibility into operations for global situational awareness.
Government agencies and local authorities need answers fast
And whenever government officials need to make sense of large volumes of data, graph databases can provide the answers. For example, graphs are also being deployed at the top of the British government. In a recent GOV.UK blog post, ‘One Graph to rule them all‘, Whitehall data scientists Felisia Loukou and Dr. Matthew Gregory discuss deploying their first machine learning model with the help of graph technology. Their graph-based system automatically recommends content to GOV.UK users, based upon the page they are visiting.
The system learns continuous feature representations (a list of numbers) for the nodes, which can then be used for various machine learning tasks, such as recommending content.
Government agencies and local authorities store considerable amounts of data and need answers fast. Graph technology enables public sector organisations to do that and more. The technology helps perform deep and complex queries that reduce infrastructure costs, in order to use advanced data technology and AI to meet the urban, climate and social challenges of the 2020s.


