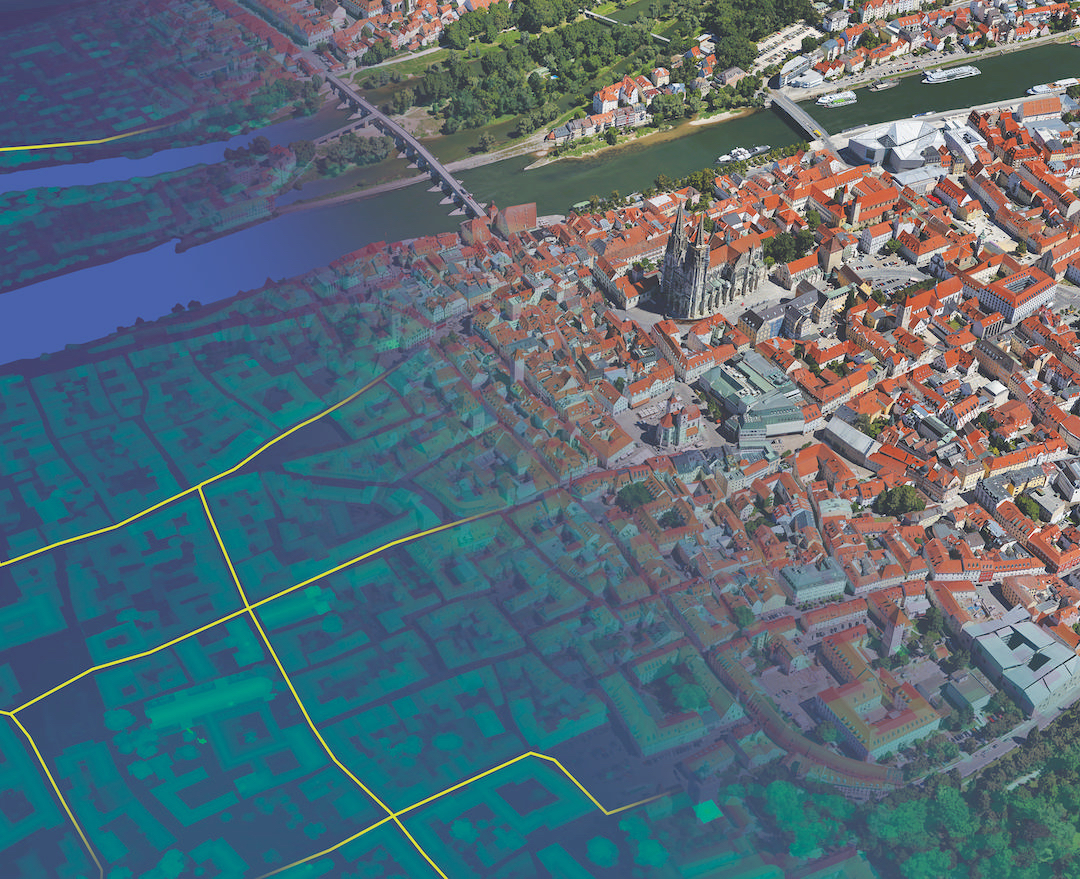
For many organisations and businesses, big data is an integral part of their information strategy, to help drive operational efficiencies and competitive advantage. In increasingly competitive markets and with heightened efficiency and cost-cutting demands on the public sector, it is vital that organisations give users the right tools to support big data in context of the 5Vs: volume, velocity, variety, veracity and value.
This presents a serious challenge for many. The digital universe is estimated to grow 50-fold between 2010 and 2020. Smartphones and mobile devices are ubiquitous, enabling user information to be continuously collected through sensors and GPS. Tracking sensor capabilities are also being extended to vehicles capturing real-time behaviour. Billions of card and mobile payment transactions are made every day.
Organisations therefore have to learn how to manage multiple information sources and adapt to the growth, speed and complexity of big data. However, when it comes to big data – whatever the source or type of data – it has one predominant common thread: location.
Why location matters
In the past, the location element of data has been under-utilised. But this is now changing, and we are starting to see increased awareness of the value gained by analysing big data in a geographic context.
> See also: Ordnance Survey maps the UK in Minecraft
The emergence of Location Analytics tools is driving desire for the ability to discover location-based patterns and relationships from data that may exist in many disparate places, streams or web logs. Enabling us to visualise and analyse big data to reveal patterns and trends that would previously have remained hidden.
Bringing together maps and multiple data layers let you see the story behind your data. Retailers can see where promotions are most effective and where the competition is. In financial services, credit card companies are mapping data from transactional systems (RDBMS), customer information (CRM) and social media streams, to build more complete profiles of card users and their behaviours, to help shape outbound marketing strategies and fraud detection. Climate change scientists can see the impact of shifting weather patterns.
Spatially-enabled big data on a map allows you to answer questions and ask new ones. Where are disease outbreaks occurring? Where is the insurance risk greatest given recently updated census data? And by putting social media data on a map you can track dynamic behaviour and sentiment in real-time. The map becomes so much more than just a visual representation of your data.
There are huge potential benefits. Big data technologies provide access to unstructured machine-generated, web-generated and NoSQL data. Map visualisation and spatial analysis on this data can reveal patterns and trends that are beyond the capabilities of traditional databases, spreadsheets and files. Now, with the emergence of GIS tools for big data processing frameworks like Hadoop, analysis and predictive modelling can be carried on massive data sets to gain unrivalled insight.
Governments can use it to design disaster response plans. Agriculturalists can analyse the recovery of low-lying farmland after flooding. Health service organisations can model the potential spread of a disease and identify strategies to contain it.
> See also: Chartered surveyor Coastway puts drone to work
The Energy Saving Trust works with the Government, local authorities and commercial organisations to help them improve energy efficiency initiatives and reduce fuel poverty. They combine information from various big data sources including open data, demographic and solar potential (using data taken from satellites to understand roof pitch and positioning), to identify housing that is suitable for specific energy-saving measures.
Previously, as much as two thirds of the cost of delivering an energy efficiency scheme was down to identifying and locating the right type of homes. By using Location Analytics and reducing this cost of delivery, the Energy Savings Trust can help deliver more energy saving measures into the UK housing stock, in a more cost-effective way.
Moving forward
Big data is not just about a mass of data, it’s about an approach to working with data, the Location Analytics tools required to work with it, and derive business value. The Aberdeen Group’s recent report 'Location Analytics: Putting the Evolution of BI on the Map' revealed that organisations with data visualisation tools are able to access timely information 86% of the time, compared to 67% of the time for those without visualisation tools.This means that BI users without data visualisation have to make twice as many decisions based on gut instinct or incomplete, outdated information. By engaging complex data sets in an intuitive visual format, users find what they need, when they need it.
By bringing together big data and mapping, businesses and organisations can tap into a whole raft of benefits. They can drive faster time to market by highlighting previously unseen patterns and relationships within existing data sets. They can bring together different technologies like BI and CRM with Location Analytics to deliver enhanced business insight. And for organisations adopting it, the potent combination of big data and mapping can ultimately lead to more accurate decision-making as well as act as a driver of business strategy, potentially delivering enhanced customer engagement, improved profitability and greater competitive advantage.
Sourced from Sharon Grufferty, Head of SaaS Product Management, Esri UK


