Moving from passive analytics — looking at insights after the fact — to active analytics — in the moment, interactive analysis — is a necessary step for enterprises looking to accelerate data innovation.
Data is the new currency, or oil, or whatever you want to call it. And, it’s now coming in from a variety of sources: historical, streaming and location, for example.
The problem for organisations is merging all of these avenues and applying machine learning analytics to them in order to gain value.
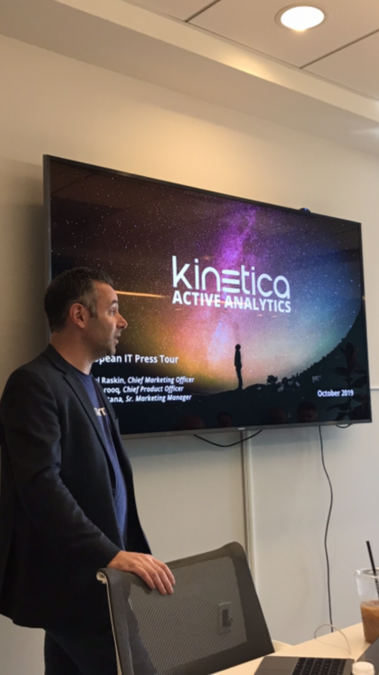
There are lots of different platforms that are used to analyse different data sources and “the more components, the more challenges there are in bringing it all together and actually deriving insights from the data,” confirmed Daniel Raskin, chief marketing officer at Kinetica — the GPU-powered, in-memory database management system.
A look at data analytics trends for 2019
Spurring data innovation
Founded in 2016, with roots developed from an innovation initiative for the US army (to track and analyse national security threats and deliver real-time active analytics), Kinetica helps organisations create smart applications through active analytics that drive data innovation — “we’re an augmentation of traditional data platforms, not a replacement for them,” explained Raskin. “We work in concert with SAP, Oracle and Teradata.”
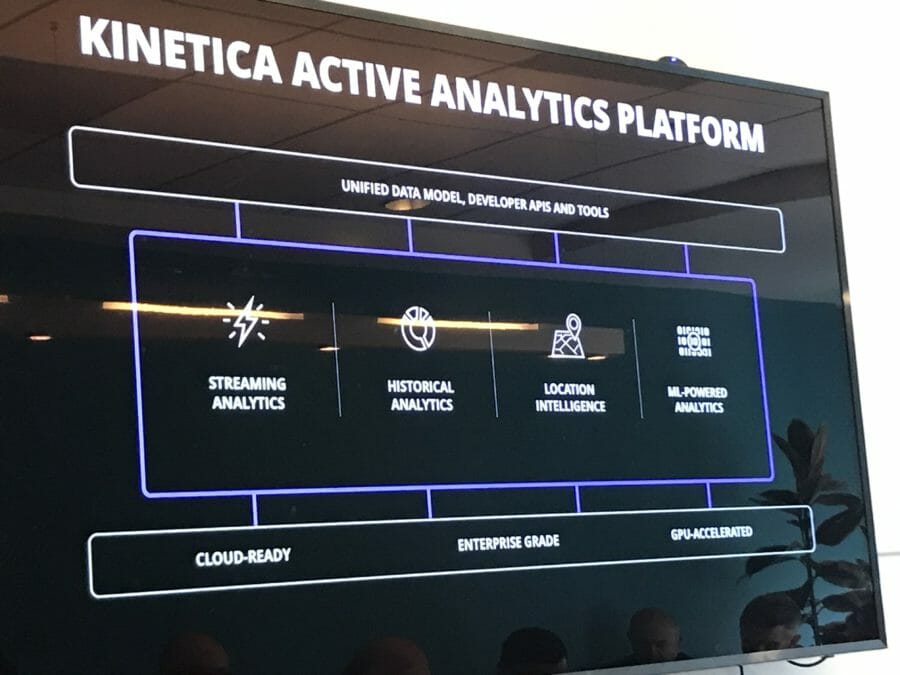
The aim is to bring together “all these analytics techniques [historical, streaming and location] to seamlessly integrate algorithms and ML models into active analytical applications,” commented Irina Farooq, chief product officer at the company.

Active analytics
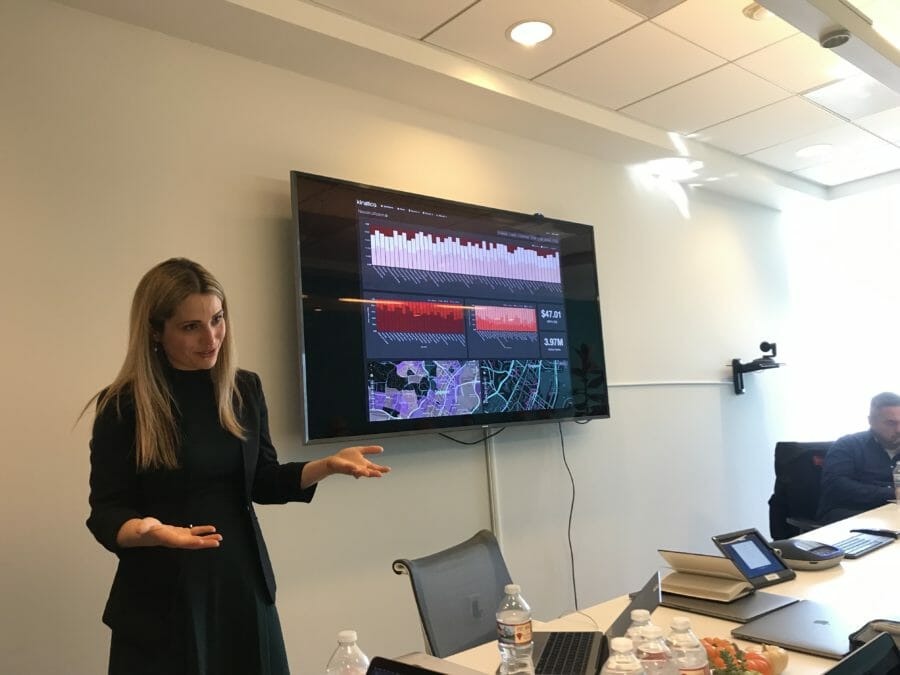
Active analytics, in the moment analysis, allows developers to build smart applications that transform business.
There are enterprise use cases that cut across almost every vertical and include; designing rich customer experiences, reducing fuel costs and carbon footprints, bringing new medicinces to the market faster, quantifying risk, optimising 5G network coverage and making self-driving smarter.
Kinetica’s active analytics use cases
1. (Retail)/Payments
Ovo, Indonesia’s largest digital payments platform, serves over 110 million customers a day and is using active analytics to build 360-degree customer profiles to understand the customer better and deliver increasingly personalised offers.
Retail innovation: adopt tech and adapt to changing consumer and employee demands
2. Financial services: enabling continuous value-at-risk calculations
Currently, value-at-risk is not happening in real-time. Instead, banks are measuring risk at the beginning and end of each day. “They’re not basing risk on live streaming data, which is both surprising and an opportunity,” said Farooq.
Why? Because it’s an incredibly complex data engineering task to analyse risk. However, by deploying an active analytics platform, banks and other financial institutions can analyse risk continuously as market activity is coming in. “It allows for a constant recalculation of the risk,” continued Farooq.

3. Logistics: optimising mail delivery nationwide and replenishing stock
The United States Postal Service is using active analytics to aggregate their historical and live (streaming) data to deliver new services, such as same-day-delivery and peer-to-peer.
In the supply chain as well, active analytics is being used to make real-time repleshinment a reality.
One of the greatest costs to retailers is running out of stock or overstocking. By streaming data from all the warehouses and stores, analysing the inventory and predicted inventory, retailers can manage this challenge; depots can no, in real-time whether to send or hold stock for different items.
This requires machine learning analysis of historic data, batch/streaming data and geolocation data in real-time, and “this mash up of analytical techniques hasn’t been possible before at such a huge scale,” according to Farooq.
Data gravity: bring data closer to machine learning
4. Telecommunications: accelerating geospatial analytics for network optimisation
As 5G comes into play, mobile network operators will need to be able to predict how specific locations affect coverage. This can take years of testing, but with active analytics, identifying optimum locations can be reduced to minutes, speeding up the data scientists and analyst lifecycles.
Telcos have their own signal and coverage data, but they don’t have the ability to analyse the what-if scenarios.
Coming back to 5G network planning, a line of sight infrastructure is crucial, and analytics is needed to see where any disruptions might occur. “Telcos must have the right models for coverage, and the next stage will see them react to real-time events,” continued Farooq.
How will 5G unlock revenue streams and increase profitability?
Telkomsal, one of the largest telcos in Asia, is using Kinetica to do just this and deliver deeper network and subscriber insights in real-time. “The Kinetica engine is built for extreme data and provides real-time data analysis and location intelligence across our business,” a spokesperson said.
Similarly, another customer, Softbank, is using real-time geospatial visualisations to improve network performance and customer service via Kinetica.
Another customer highlighted the value of active analytics as currently, “we’re wasting a significant amount of time and effort managing a hodgepodge of big data solutions with poor agility.”
“This is not a business intelligence solution, but a customer application one” — Farooq
5. Pharmaceuticals
GlaxoSmithKline, deploying primarily out of the UK, is using Kinetica to analyse its large number of data sources to get to the answer faster:
6. Automotive
The journey to autonomous vehicles is just at the beginning. Those developing these vehicles need to be able to analyse data while the vehicles are driving to refine models and policies to improve the experience. Analytics is crucial in measuring the effectiveness of these models as organisations pursue level 5 automation.
Real-time in-car analytics (at the edge) is also needed to achieve an autonomous future; distributed architecture and infrastructure is needed in the car, as well as the ability to run analytics in the cloud.

Smart analytics applications
In the world of data, it’s important to talk about the real use cases — how will this impact my business and transform my industry?
Organisations can no longer be passive in their analytics ventures. They need to be active. They need to take all the data a variety of sources, aggregate it and visualise it. Once collected on a unified data platform, the ability to run machine learning on top of that represents a game changer for every industry; smart analytics applications that haven’t been created before.
Related articles
A look at data analytics in the financial services industry: use cases and challenges
Gartner: top 10 data and analytics technology trends for 2019
How data analytics is changing the insurance industry
Predictive analytics in HR management
Embracing predictive analytics in the fourth industrial revolution


